
 Some sports are number-laden, such as Formula 1, and that makes some of the stats and the jargon hard to keep up with. This is also the case with Cricket, as there are so many measurable variables to keep track of. Strike rates are certainly part of that and they mean two different things in this sport. There is more than one ‘strike rate’ to keep track of in cricket.
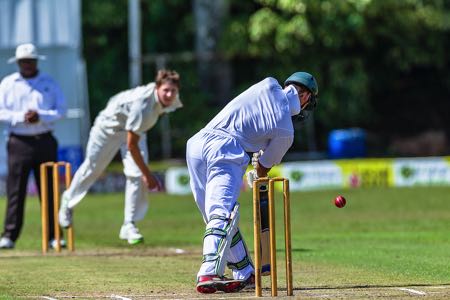
A batting strike rate refers to how quickly a batsman scores runs. This is measured in ‘runs per 100 balls’. If it took a batsman 114 balls to score 56 runs, his strike rate would be 49.12. The higher the figure, the better. A bowling strike rate measures how quickly bowlers take wickets. This time their wickets, i.e., getting batsmen out, are measured in balls per wicket. With that, the lower the strike, the better.
Bowling economy rates are considered more important to many, which measures how many runs a bowler concedes per over, but strike rates are important as taking 20 wickets to win a match is about as important a factor in the game as any. Though some stats can be gathered retrospectively, the keeping of strike rates is pretty modern and only started after one-day international cricket (ODI’s) began in the 1970’s.
Strike Rates in Bowling
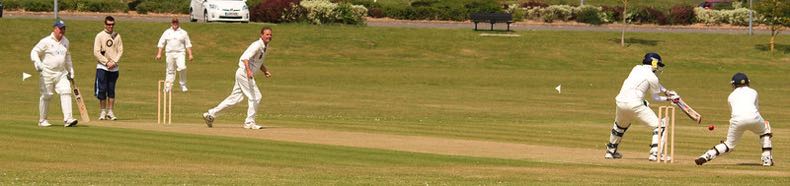
A bowlers strike rate is defined as being the average number of balls they have bowled for each wicket they have taken. If a bowler has a low strike rate, they are considered to be good. Despite their early history, bowling strike rates are more important to test cricket than to ODIs. Captains are always looking for a way to win a test match and a bowler with a low strike rate is like gold dust.
Best Test Bowling Strike Rates
Using the men’s game as an example, these are the top five best strike rates recorded for bowlers in test cricket:
| Player | Country | Balls Bowled | Wickets | Strike Rate |
|---|---|---|---|---|
| George Lohmann | England | 3830 | 112 | 34.1 |
| Duanne Olivier | South Africa | 2088 | 59 | 35.3 |
| JJ Ferris | England/Australia | 2302 | 61 | 37.7 |
| Shane Bond | New Zealand | 3372 | 87 | 38.8 |
| Sydney Barnes | England | 7873 | 189 | 41.6 |
Somewhat predictably, these are all players who did not have particularly long test careers. Arguably, it is easier to create impressive stats over a shorter period of time. Contrast this with James Anderson and his 690 wickets at the time of writing. Anderson has bowled 39,217 balls at a strike rate of 56.8. That means he has to bowl 56.8 balls per wicket, or nearly 9½ overs, before getting a player out. That would not get him near this top five, yet he is one of the most impressive bowlers of all time.
Batting Strike Rates
A batting strike rate measures the average number of runs scored per 100 balls faced. This time, the higher the strike rate a batter has, the better they are considered to be as it means they can score runs quickly. This, of course, doesn’t count for much if they score quickly and then get out, meaning average scores are also important. In test cricket, the average is more important. A player may have a big strike rate, but an average of only 30. That means that they only score 30 runs before getting out on average. An average above 40 with a healthy strike rate is good for test batsman.
The batting strike rate is very important in one-day cricket. With limited overs to face, scoring as many runs as possible when batting first is of primary importance. Scoring at a run a ball, meaning a S/R of 100, is common in limited overs cricket while in T20 strike rates of 150+ are recorded. There is little time in T20 cricket to take ten wickets, so teams are chock full of batters with the highest strike rates possible as scoring runs as quickly as possible is what the game is all about.
Best ODI Batting Strike Rates
T20 and 100 strike rates are essentially still evolving with players changing all the time. Thes however are the best batting strike rates recorded in one-day internationals:
| Player | Country | Balls Faced | Runs | Strike Rate |
|---|---|---|---|---|
| Andre Russell | West Indies | 794 | 1034 | 130.22 |
| Glenn Maxwell | Australia | 2796 | 3490 | 124.82 |
| Jos Buttler | England | 4087 | 4823 | 118.00 |
| Lionel Cann | Bermuda | 504 | 590 | 117.06 |
| Shahid Afridi | Pakistan | 6892 | 8064 | 117.00 |
Naturally, Lion Cann’s figures here are a bit of an anomaly. He only ever faced the equivalent of 84 overs in ODI’s and mostly against inferior opposition. Jos Buttler and Shahid Afridi’s stats are particularly impressive.